Market Trends

Bay Area & Stanford Circle Charts/Stats

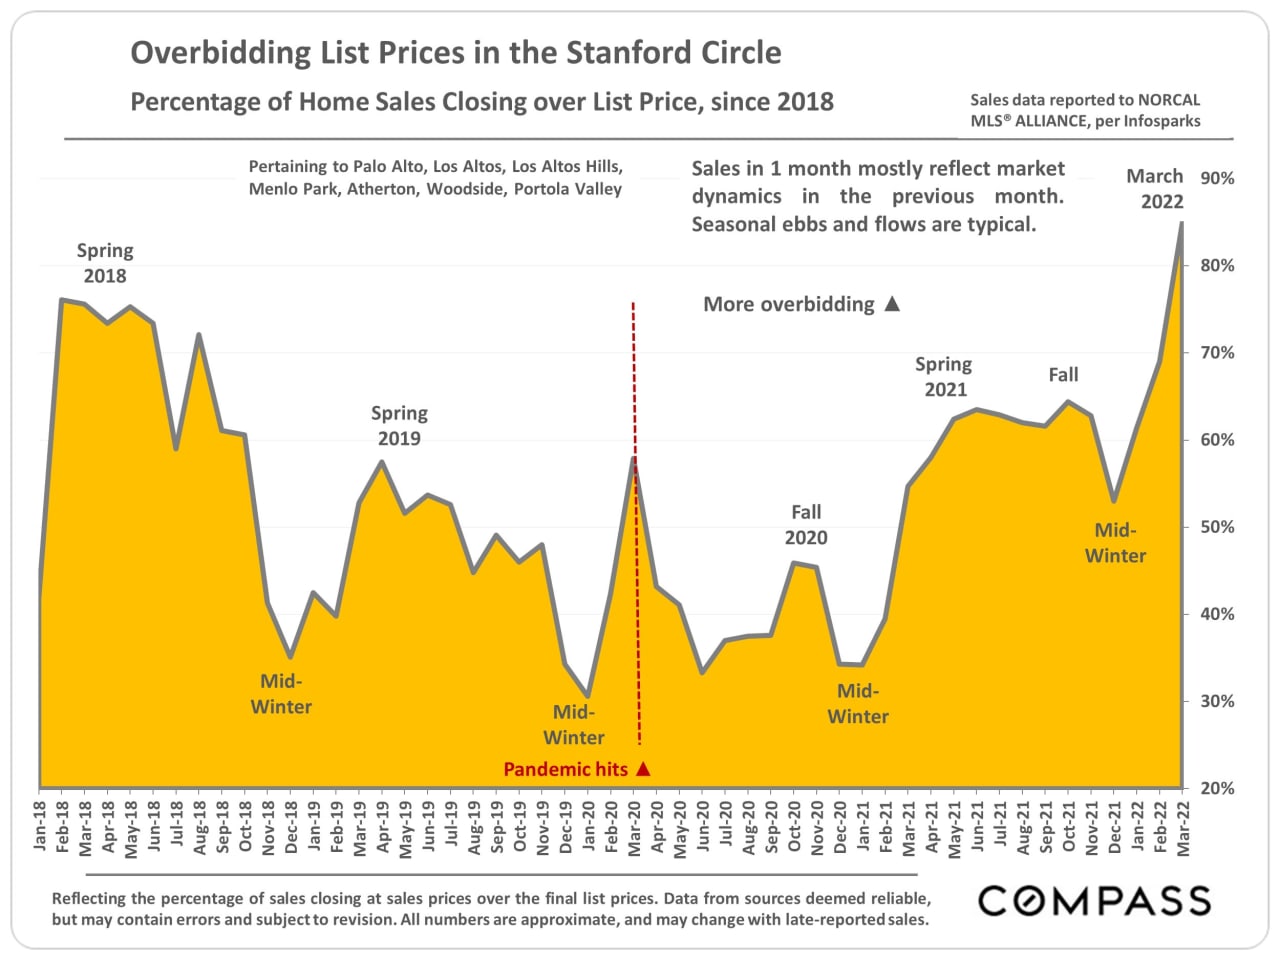
Chart of Stanford Circle home sales closing over list price, rising to about 85% by March 2022.
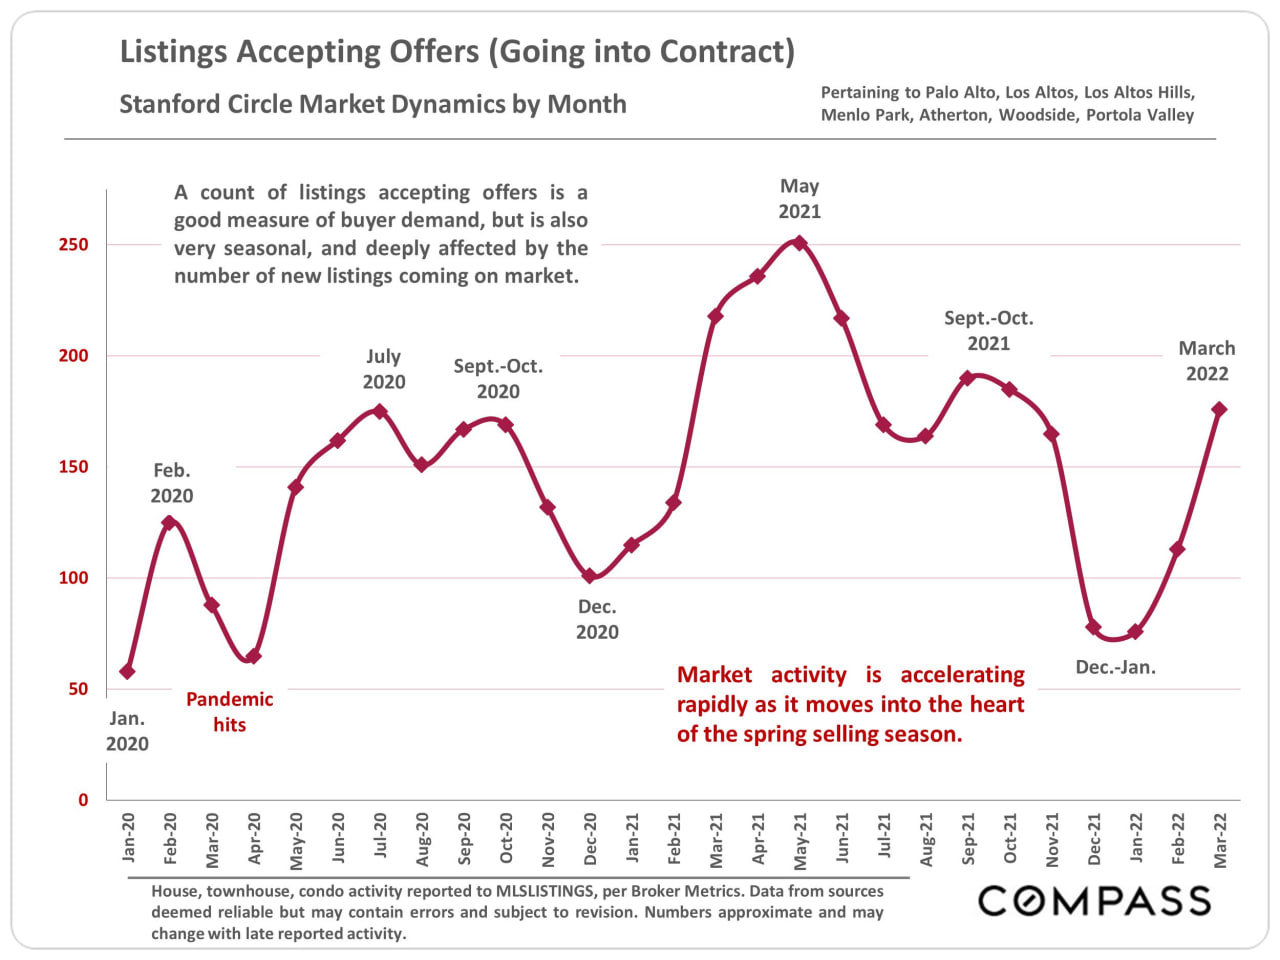
Line chart of Stanford Circle listings accepting offers, peaking in May 2021 and rising again by March 2022.
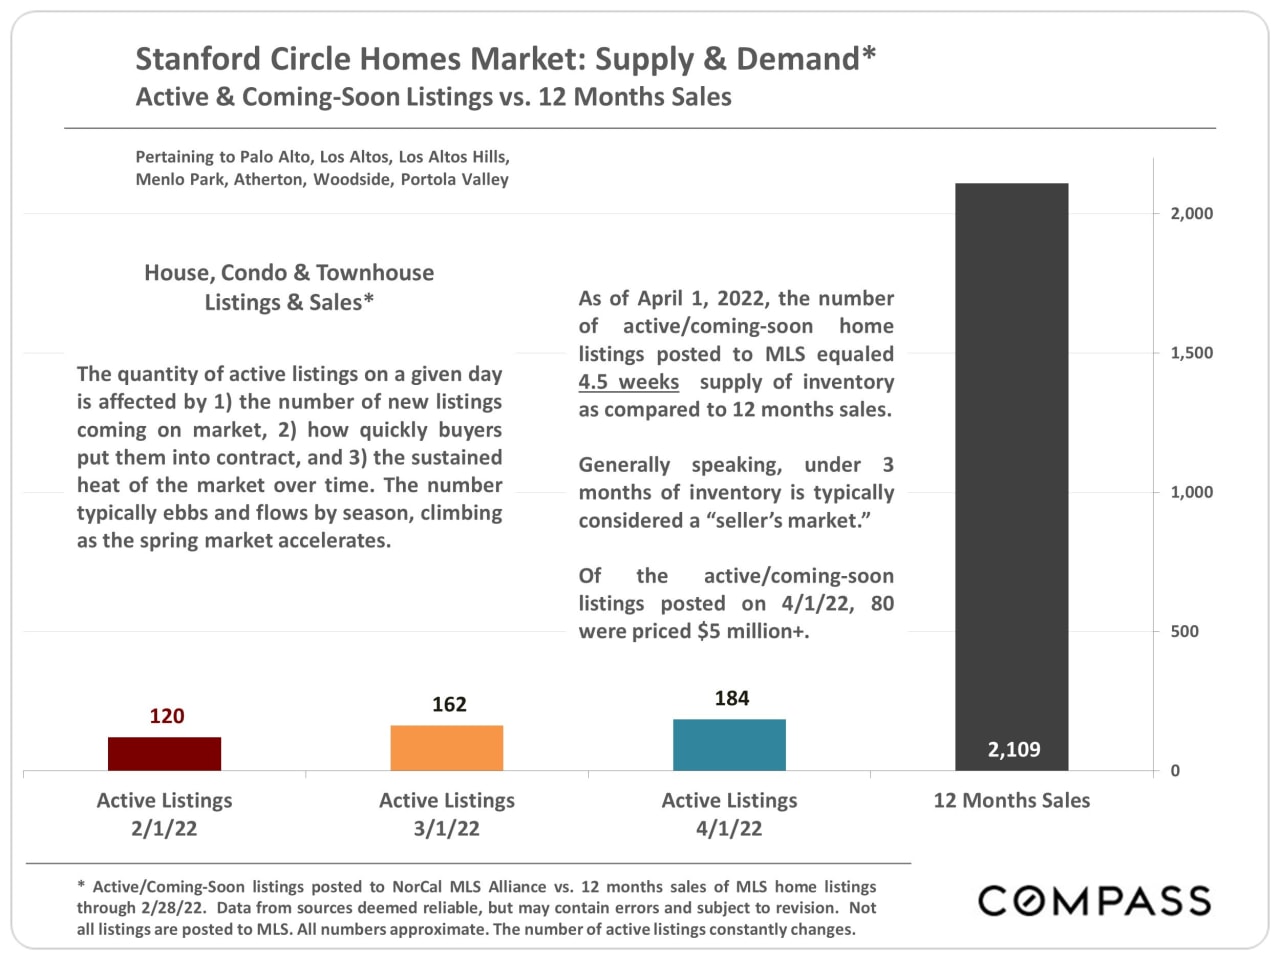
Stanford Circle housing market infographic: 184 active listings on April 1, 2022, versus 2,109 sales over 12 months.
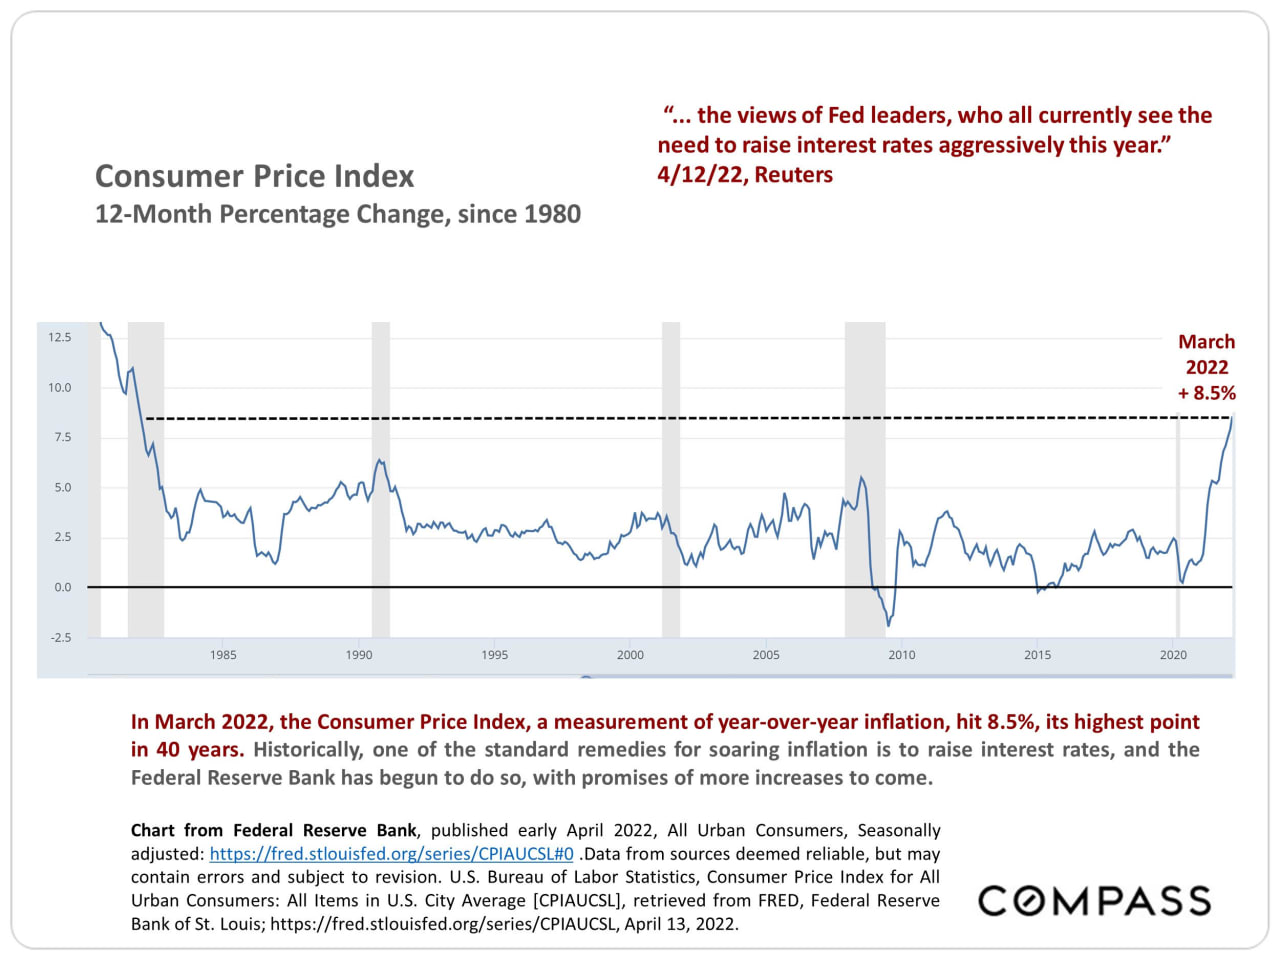
Consumer Price Index chart shows year-over-year inflation reaching 8.5% in March 2022.

Bay Area & Stanford Circle Charts/Stats

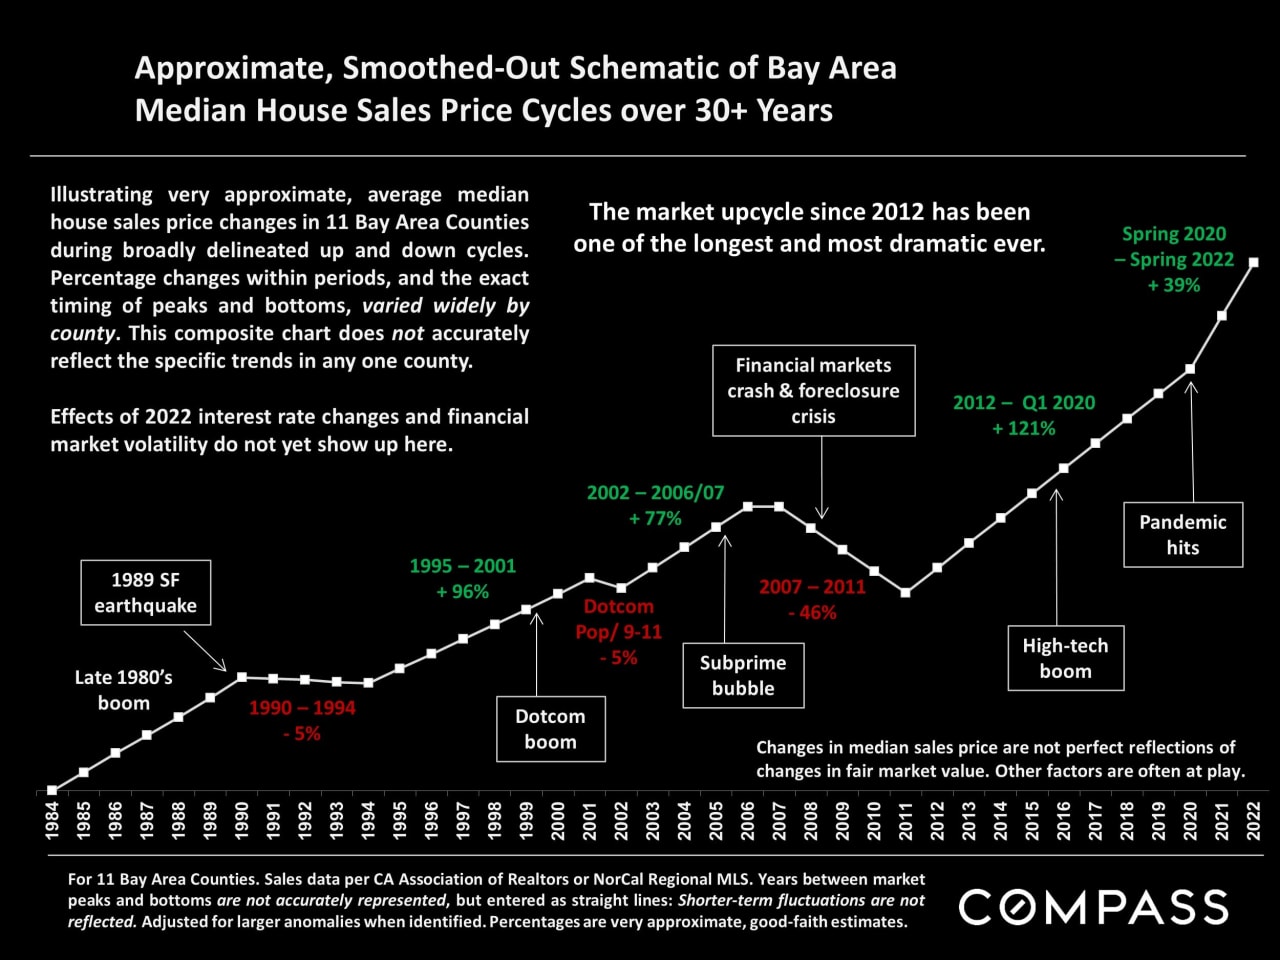
Bay Area median house sale price cycles from 1984 to 2022, with approximate gains, downturns, and market events.
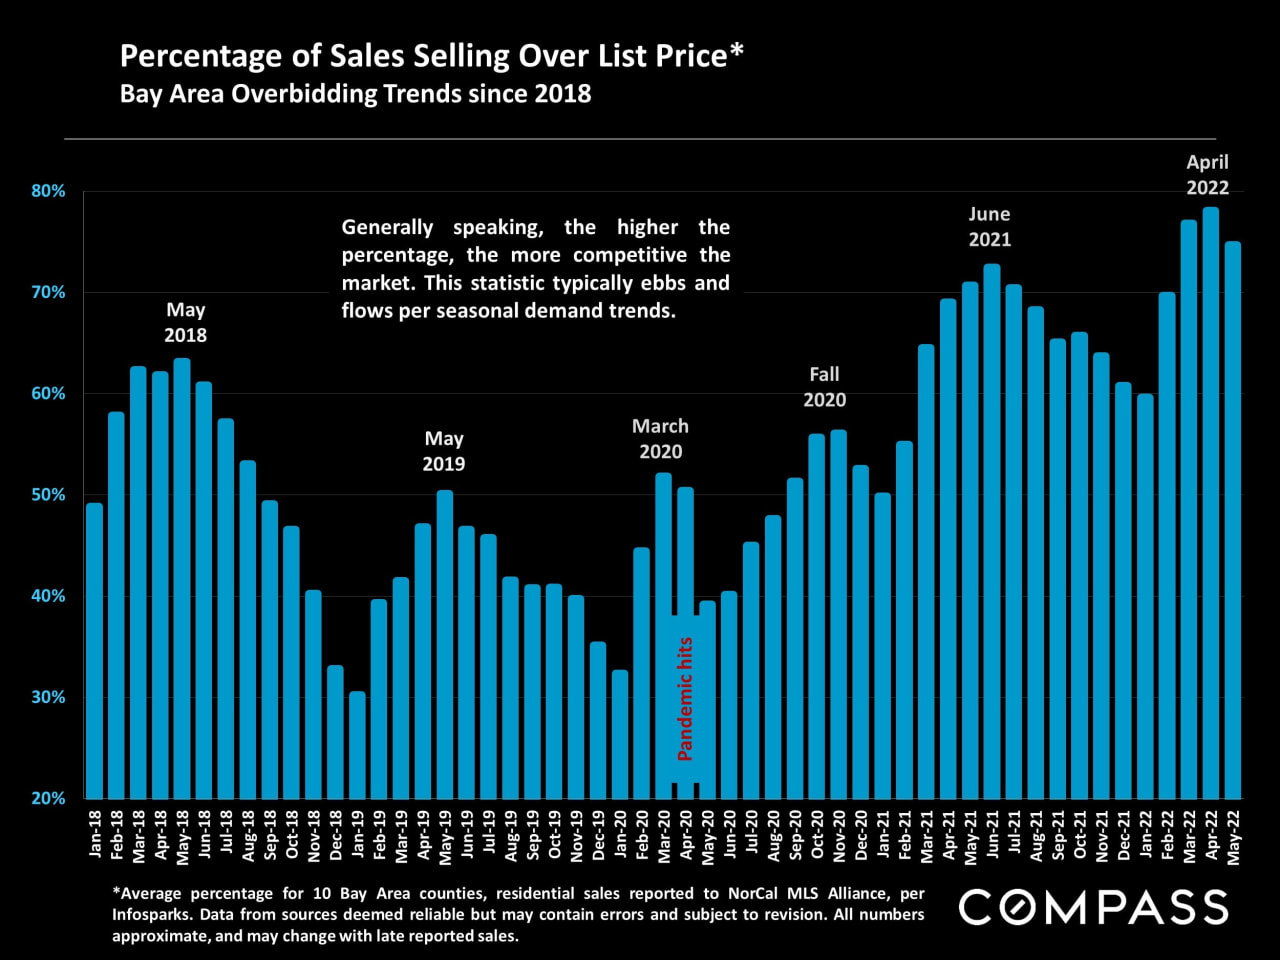
Bar chart of Bay Area homes selling over list price, with the percentage rising to nearly 80% in spring 2022.
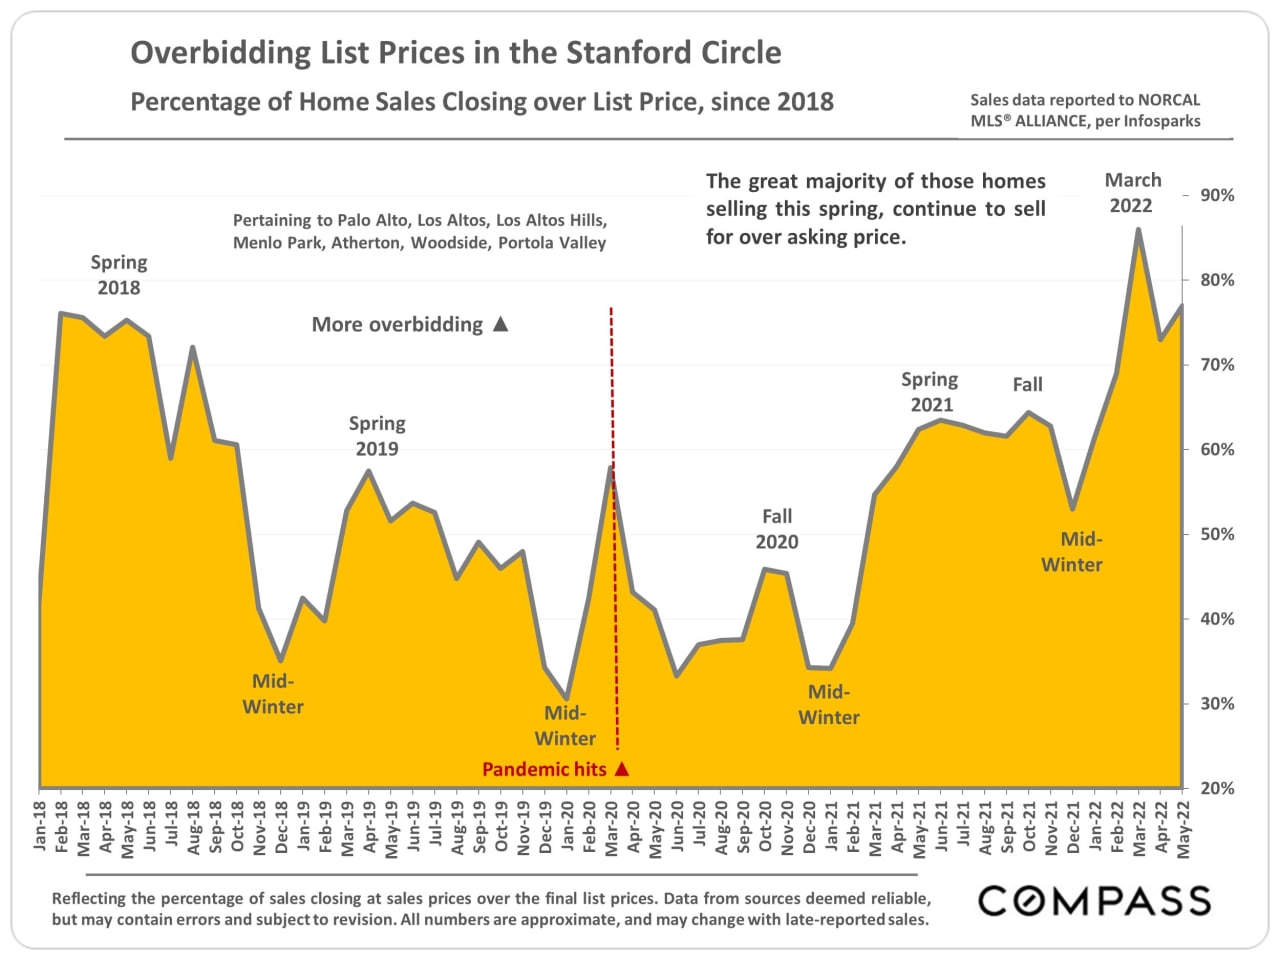
Chart of Stanford Circle home sales over list price, with overbidding rising sharply to a peak in March 2022.
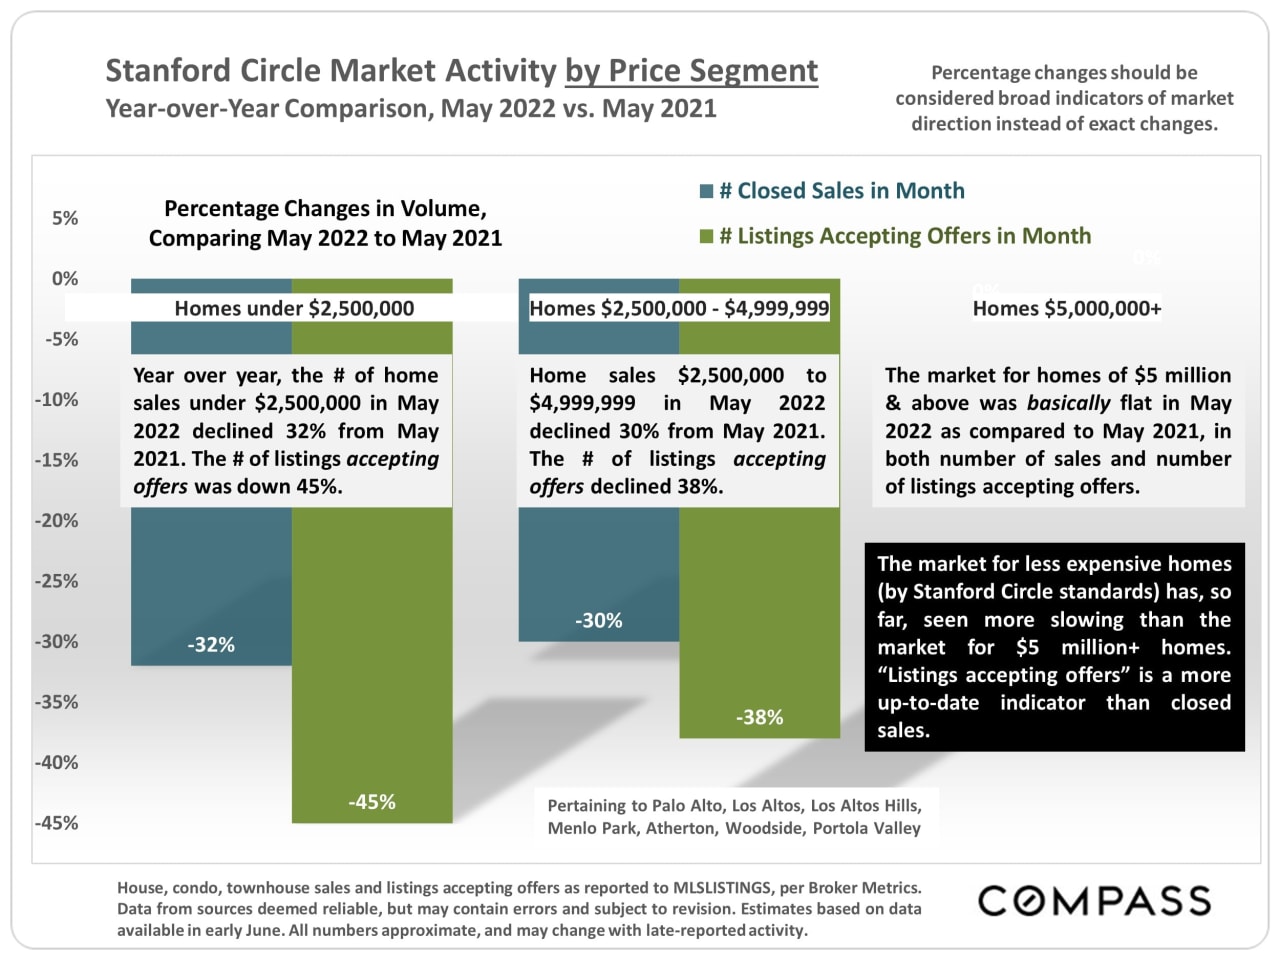
Stanford Circle market activity chart comparing May 2022 and May 2021 by home price segment.

Work With Marc

Marc has been responsible for more than $900M in transactional and joint venture revenue since he began his real estate career in New York City in 1998. Work-Play-Live-Invest! Contact him today.

Let's Connect