Market Trends

Recent Stanford Circle charts.​​​​​​

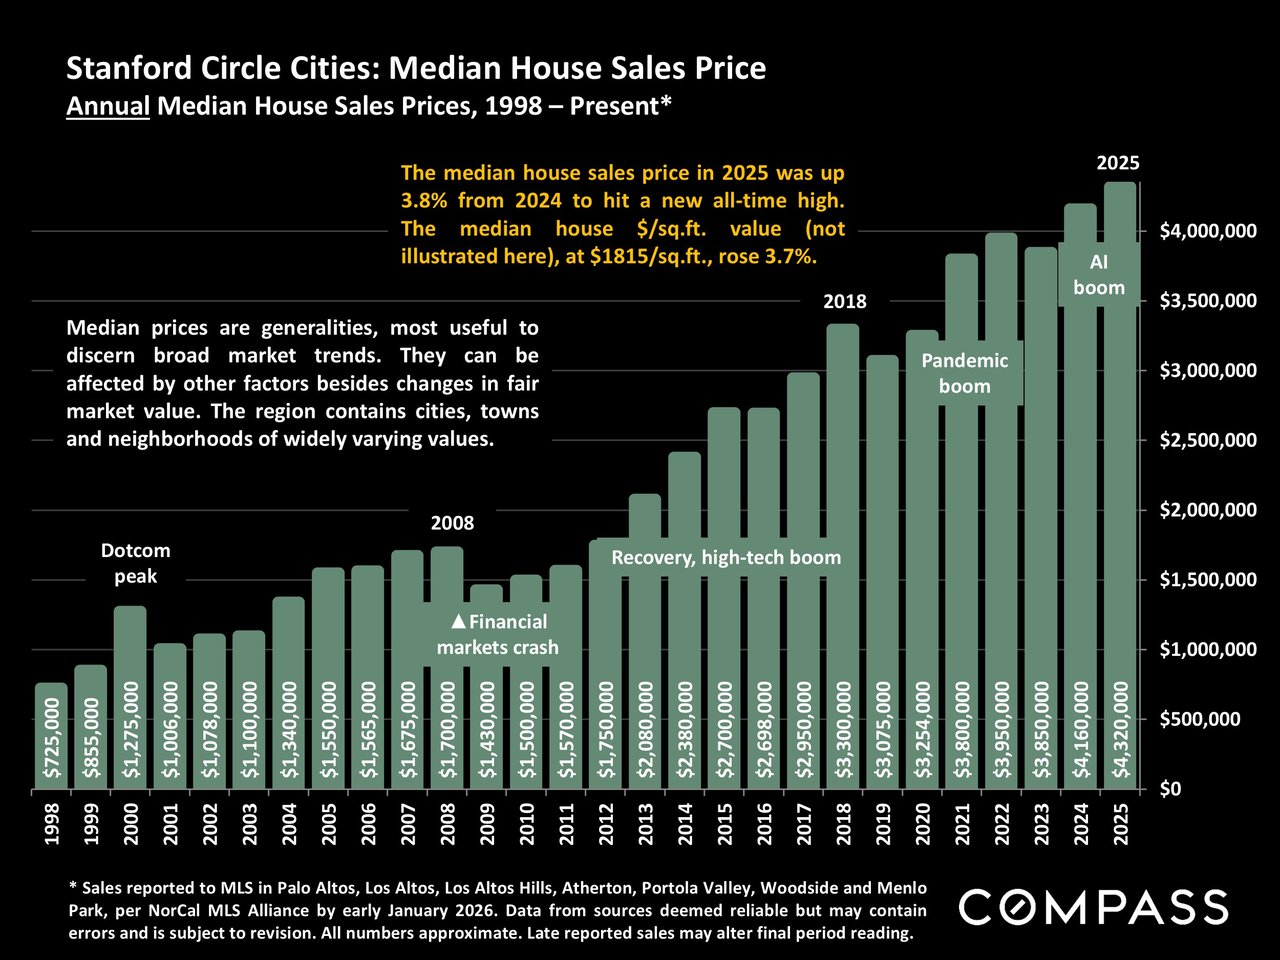
Chart of Stanford Circle Cities’ annual median house prices, rising from $725,000 in 1998 to $4.32 million in 2025.
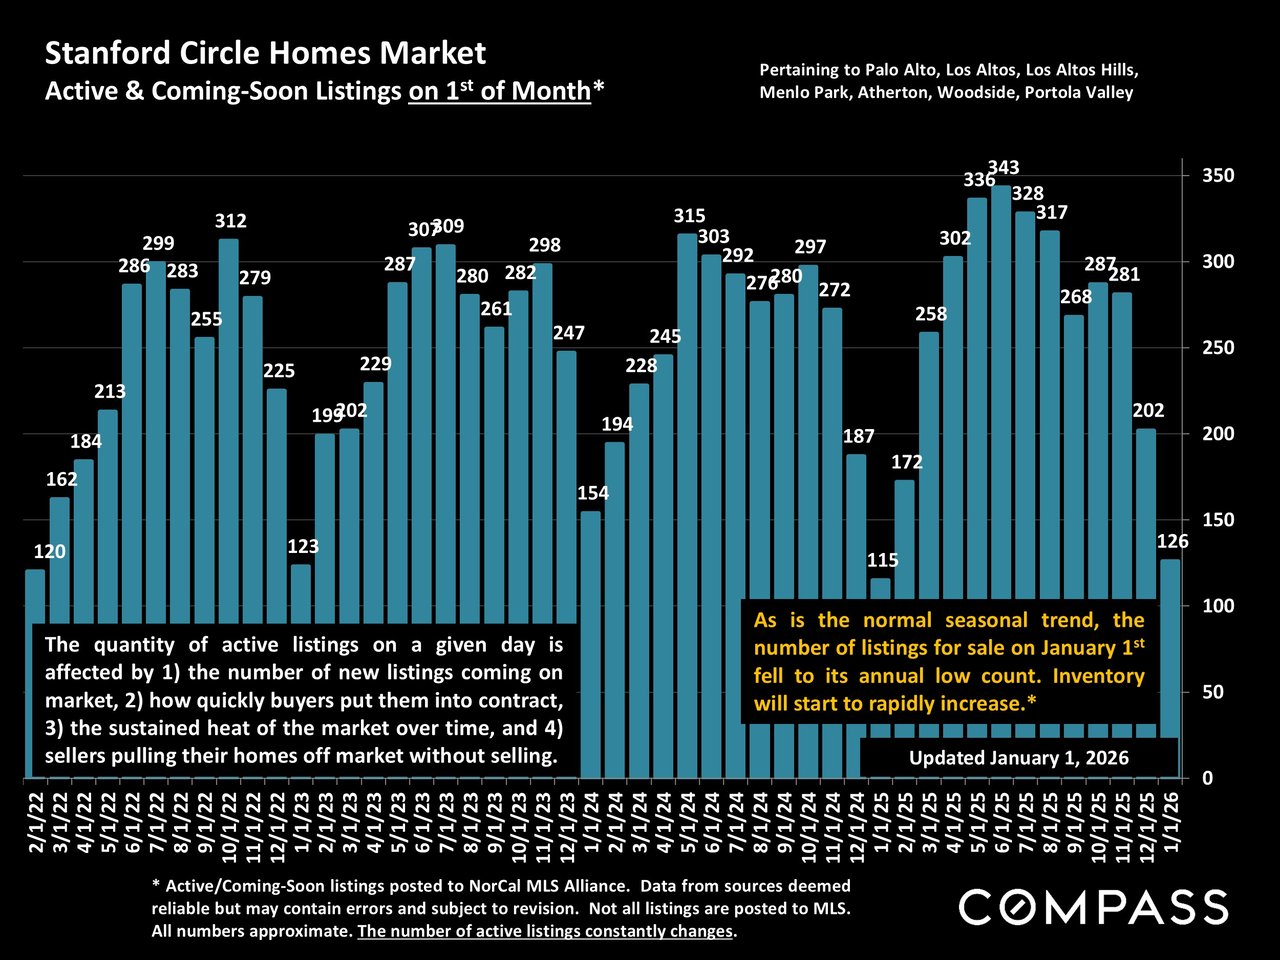
Stanford Circle Homes listings by month, February 2022–January 2026.
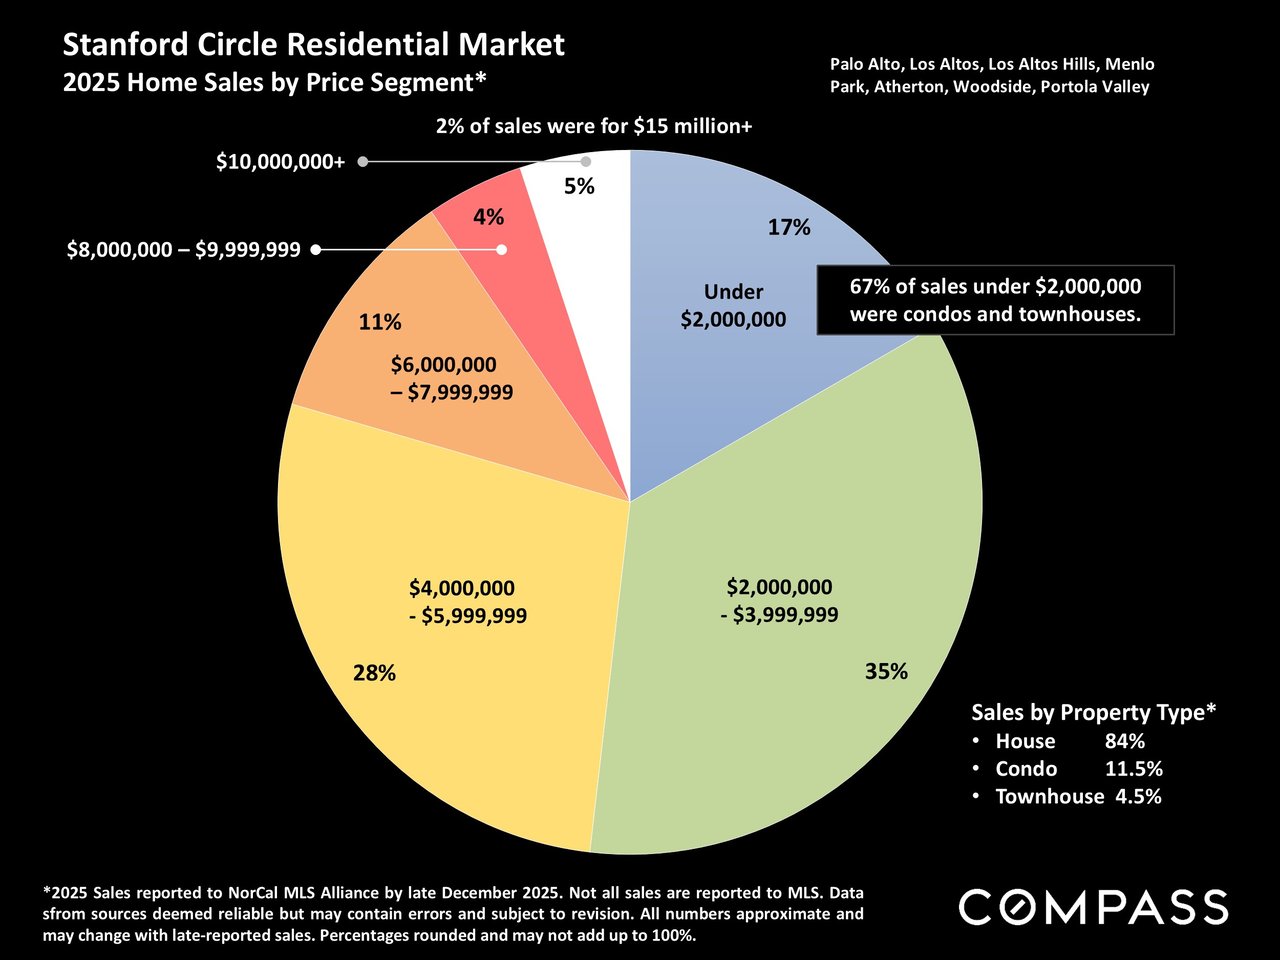
Stanford Circle 2025 home sales chart: 35% cost $2–4 million, and 28% cost $4–6 million.
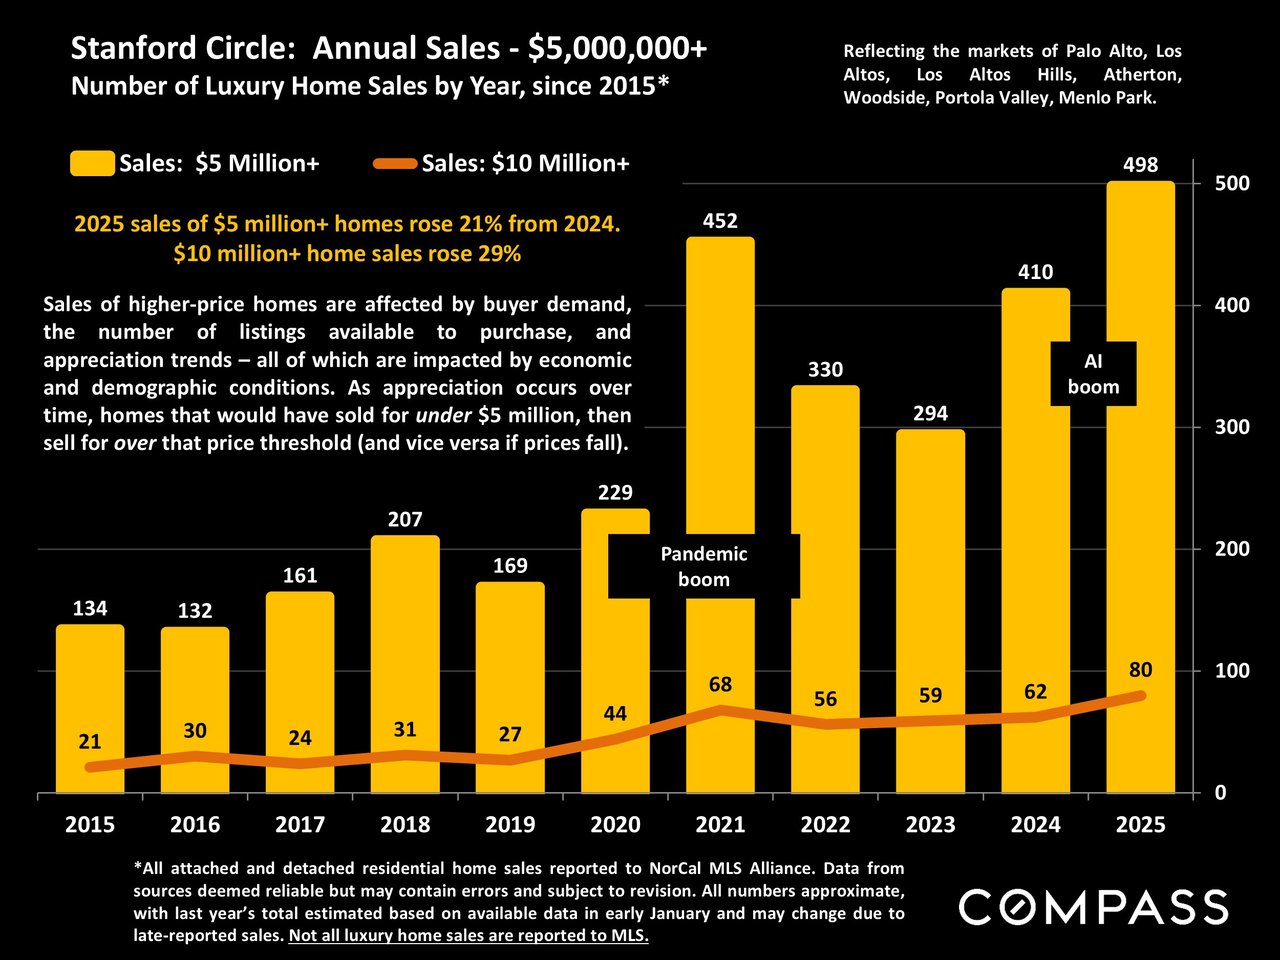
Chart of $5M+ luxury home sales in Stanford Circle, 2015–2025, with 2025 record of 498.

Recent Santa Clara and San Mateo County Housing Stats

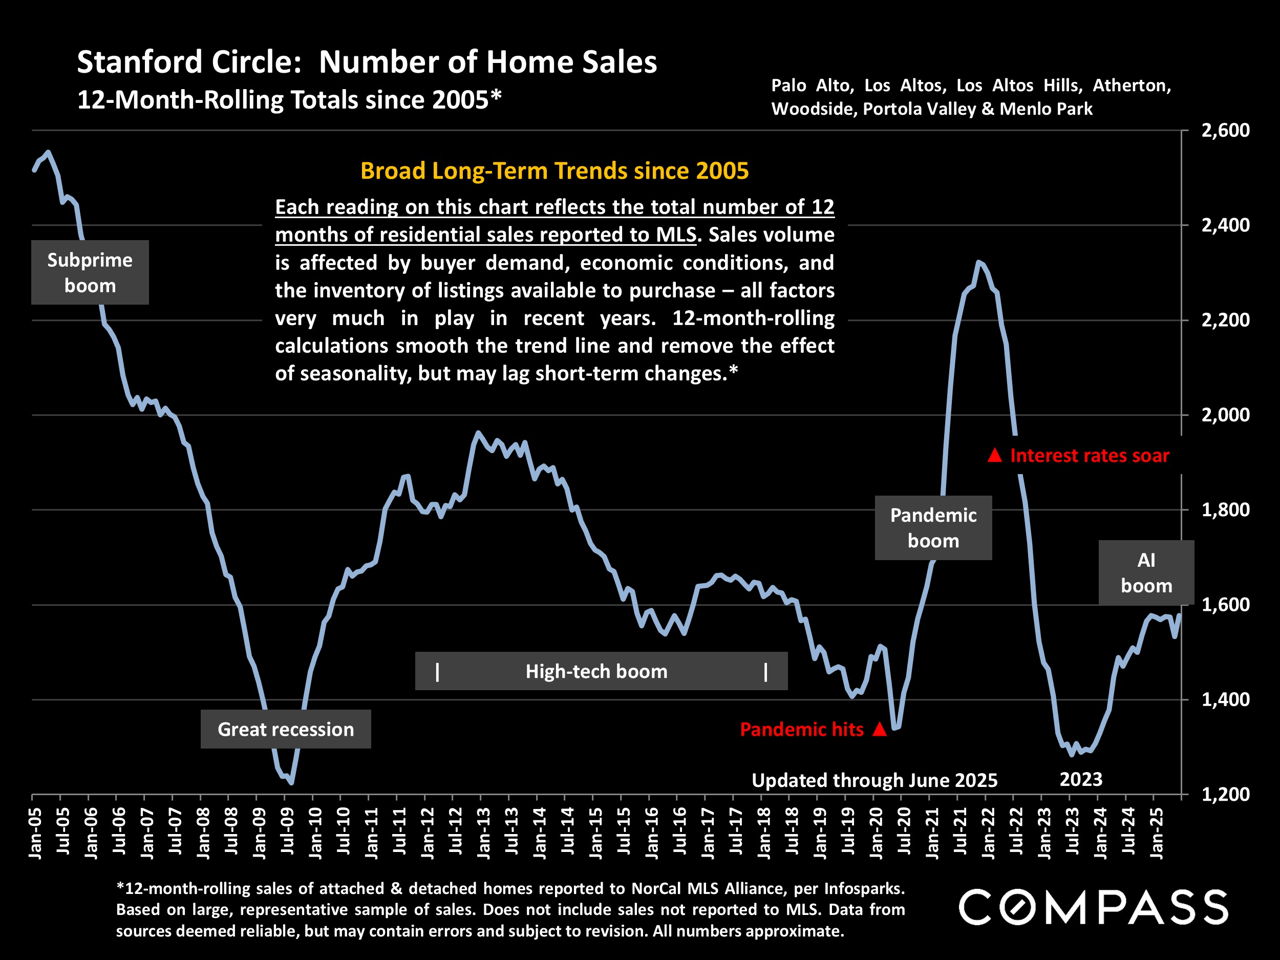
Stanford Circle home-sale trend chart, 2005–June 2025, with labeled market booms and downturns.
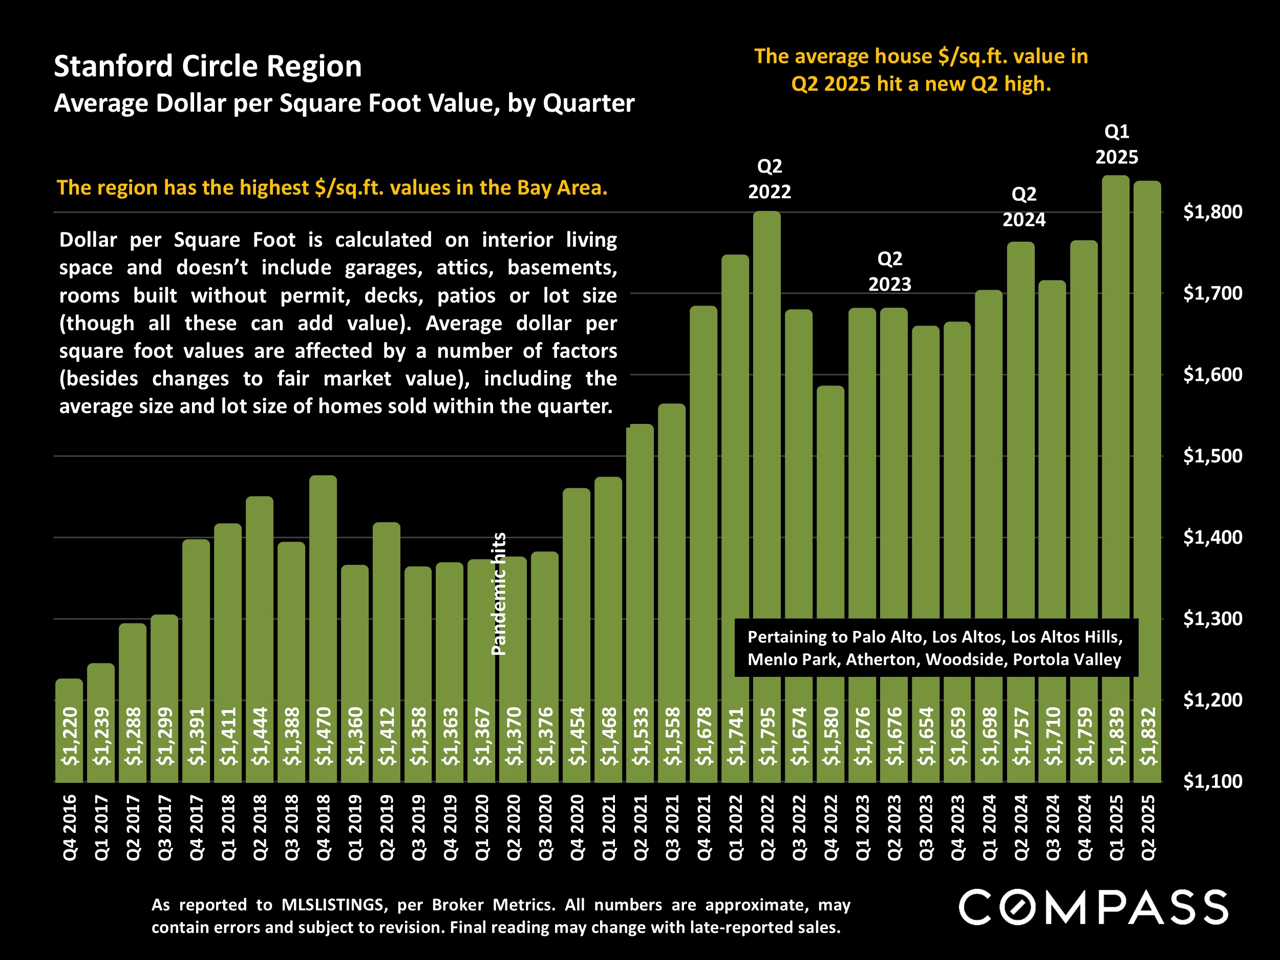
Stanford Circle Region quarterly home price-per-square-foot chart, with values from 2016 through Q2 2025.
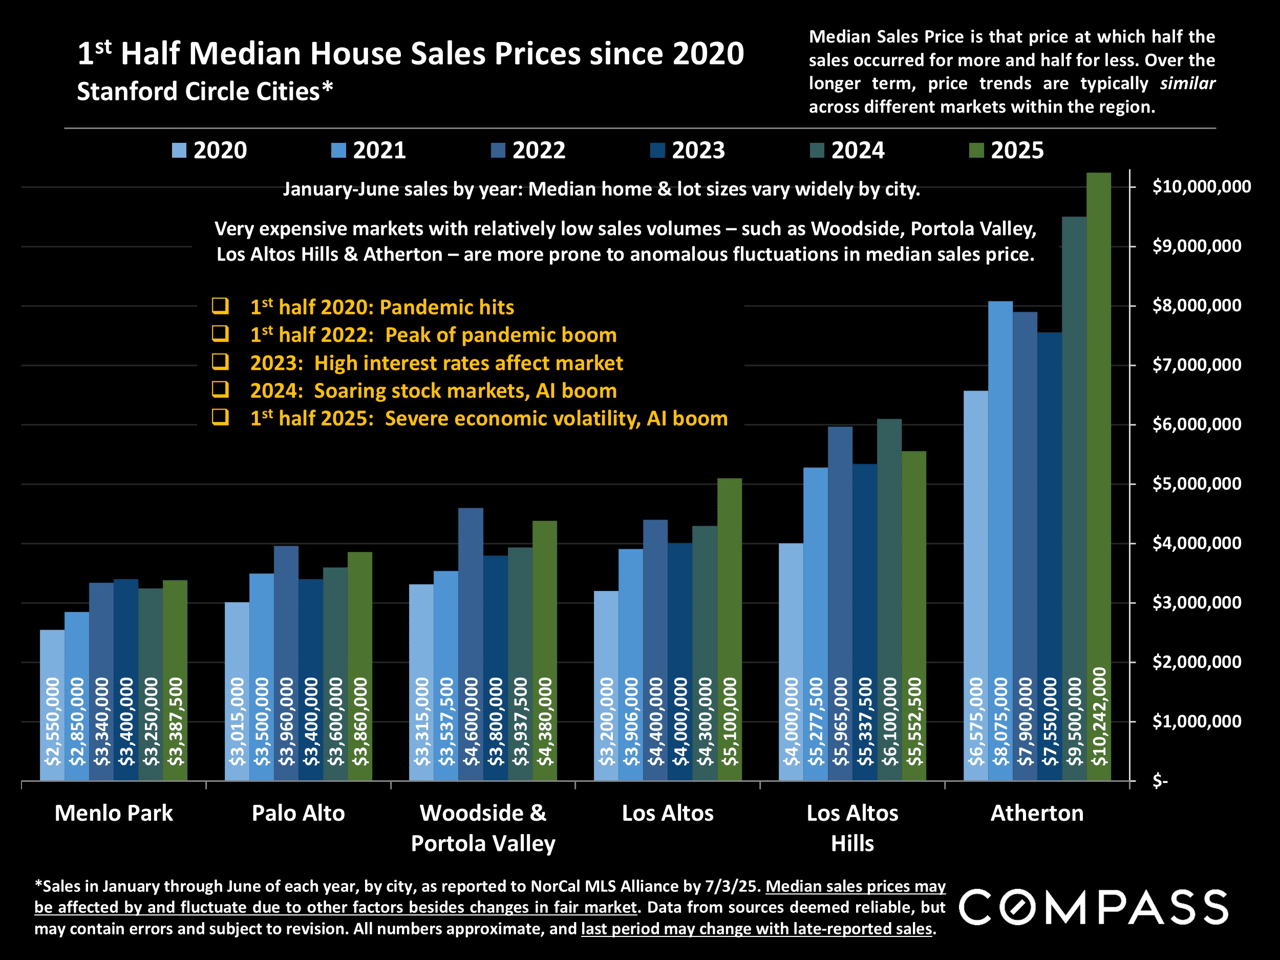
Bar chart comparing first-half median home sale prices from 2020 to 2025 across six Stanford-area markets.
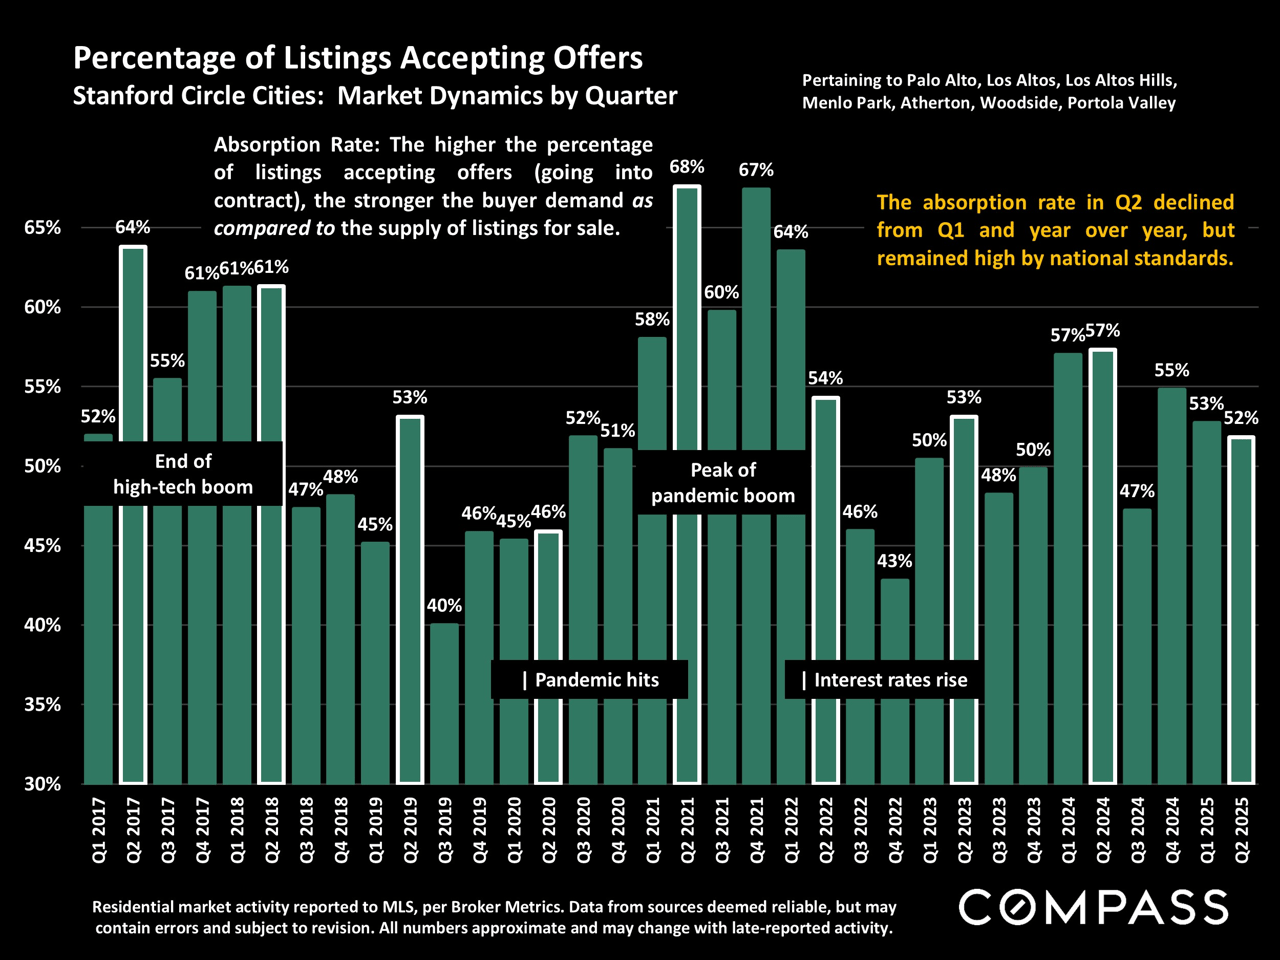
Quarterly Stanford Circle Cities listing absorption rates, with a bar chart spanning 2017 through Q2 2025.

Work With Marc

Marc has been responsible for more than $900M in transactional and joint venture revenue since he began his real estate career in New York City in 1998. Work-Play-Live-Invest! Contact him today.

Let's Connect